Inflationary Landscape
The recent release of US’ May Consumer Price Index (CPI), an inflation gauge, rose 8.6% year-on-year, higher than the expected 8.3%. The CPI increase (highest since December 1981) was a result of surging food, gas and energy prices and dashed hopes that inflation had peaked.
Rising inflation affects real wages and decreases purchasing power. The US Bureau of Labour Statistics reported that real average hourly earnings (inflation adjusted) for all employees decreased 0.6% from April to May even as nominal average hourly earnings increased 0.3%. As consumers grapple with higher prices, less would have to be spent on consumption which represents close to 70% of the US Gross Domestic Product (GDP). Recently, The World Bank released its “Global Economic Prospects” report which forecasted that global growth is expected to slow sharply from 5.7% in 2021 to 2.9% for 2022.
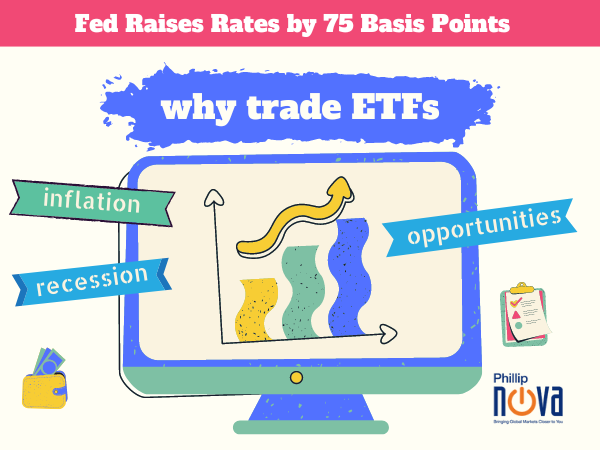
The persistent inflation is mainly due to supply side factors resulting from the China lockdown, Russia-Ukraine war and shortage in manpower. This has prompted the US Federal Reserve to tighten its monetary policy after maintaining 2 years of near-zero interest rates. This year alone, the Fed has made 3 interest hikes and most recently raised rates by 75 basis points as announced at the June FOMC meeting. This increase marks the largest rate hike since 1994.
Impact – Risk of Recession
The recent release of US CPI caused a decline in the US markets and placed the S&P 500 index in bear territory (closing more than 20% below its record high) for the first time since the pandemic. The S&P 500 index closed on 13 Jun 2022 at 21.8% below its highest closing price on 3 Jan 2022. The Fed’s very aggressive stance in raising interest rates in the midst of a rapidly weakening economy means even slower economic growth and much higher risk of a recession.
Opportunities amidst the storm
Traders and investors have opportunities in a bear market. As at 13 Jun 2022, the S&P 500 forward weighted EPS stands at US$ 236.84. At the closing price of US$ 3,749.63, the S&P 500 P/E ratio is 15.83x, lower than its past 5 years’ average P/E of 22.5x and past 10 years’ average P/E of 20.2x. The decline in S&P 500 P/E ratio was mainly due to the fall in stock prices, making it look attractive relative to historical data. Investors who are interested in investing in the US market can consider US counters like the SPDR S&P 500 ETF Trust or Vanguard S&P 500 ETF which track the S&P 500 index.
However, it is important to note that increasing recessionary expectations would lead to lower earnings. Stock prices would then further decline and investors can consider taking up positions in ETFs to hedge their existing stocks portfolio. The Direxion Daily S&P 500 Bear 3X Shares ETF and ProShares UltraShort S&P500 are 2 funds listed on the US exchanges that provide to investors the inverse returns of the S&P 500 index.
Open an account, trade ETFs and receive S$100*
From now until end of June 2022, receive S$100* when you:
1. Open a new Phillip Nova trading account and
2. Trade any 5 unique counters across any asset class
Find out more here!
Trade ETFs and Stocks on Phillip Nova
Features of trading ETFs and Stocks on Phillip Nova
- Gain access to over 9000 stocks and ETFs
Capture opportunities from the Hong Kong, Malaysia, Singapore and US markets
- Over 90 Technical Indicators
View live charts and trade with ease with over 90 technical indicators available in the Phillip Nova platform
- Trade multiple assets on Phillip Nova
You can trade Stocks, ETFs, Forex and Futures on a single ledger with Phillip Nova
For more information on the Commodities offered on Phillip Nova, please click here. For more information on our 39th anniversary promotion, please click here.


