The Silver Lining: Unravelling the Potential of Silver

17 May 2024

By Danish Lim, Investment Analyst, Phillip Nova


Silver has outperformed Gold so far, up by around 25% YTD, compared to Gold at 16%. Silver recently posted its highest close in 11 years, as April CPI data helped boost rate-cut bets, which historically benefits non-interest bearing precious metals.

Silver is mainly produced in the Americas, particularly Mexico, Peru, and Chile. China, Australia, and Russia are also major producers.


Silver Macro Overview: Solar Demand to Widen Supply Deficit

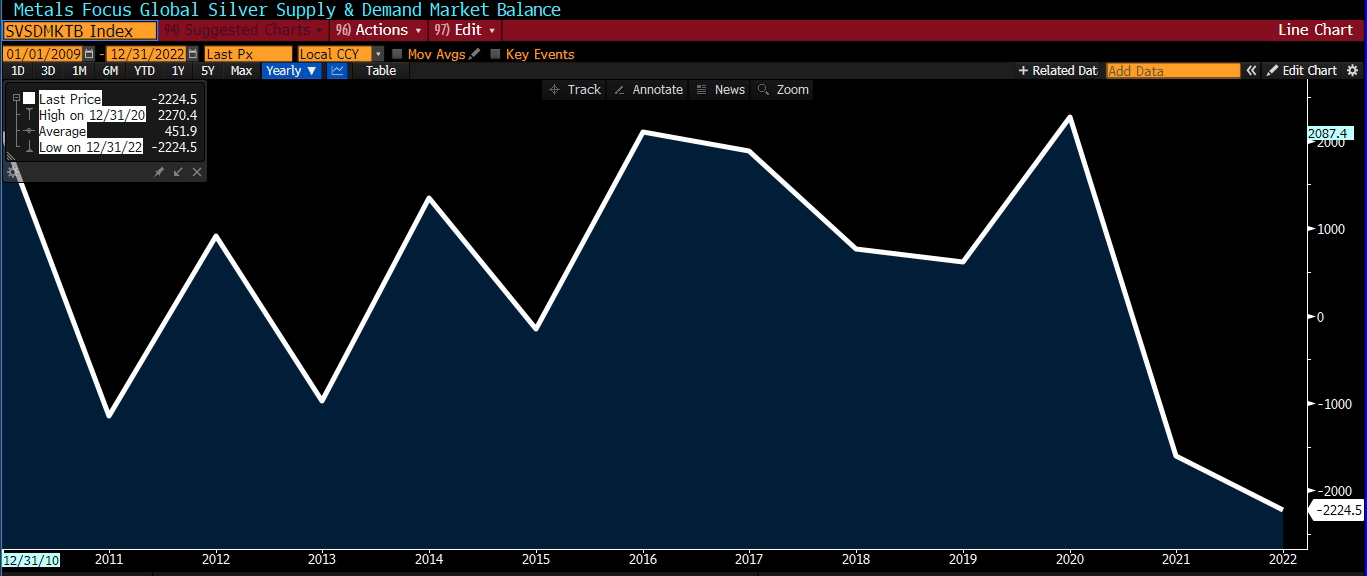
As of the end of 2022, silver is facing its largest supply deficit of around -2,224.5 metric tonnes in over a decade, revealing an imbalance in the silver market.


Silver Demand Drivers


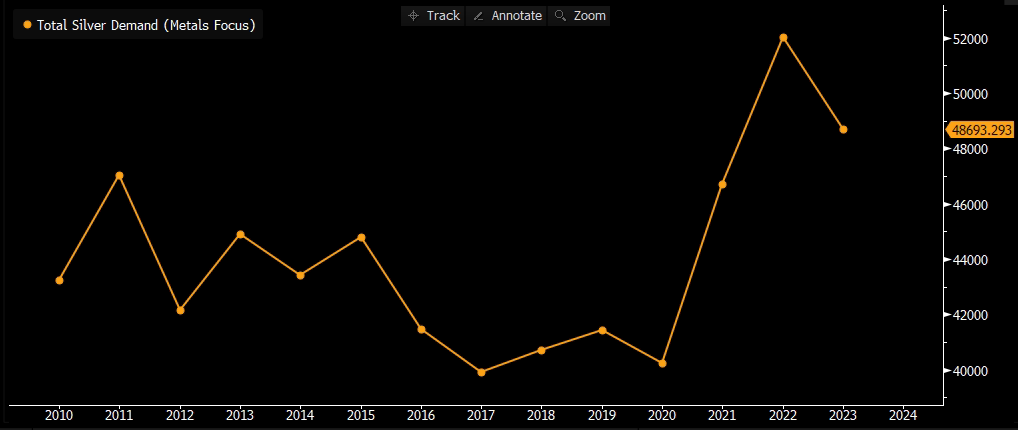
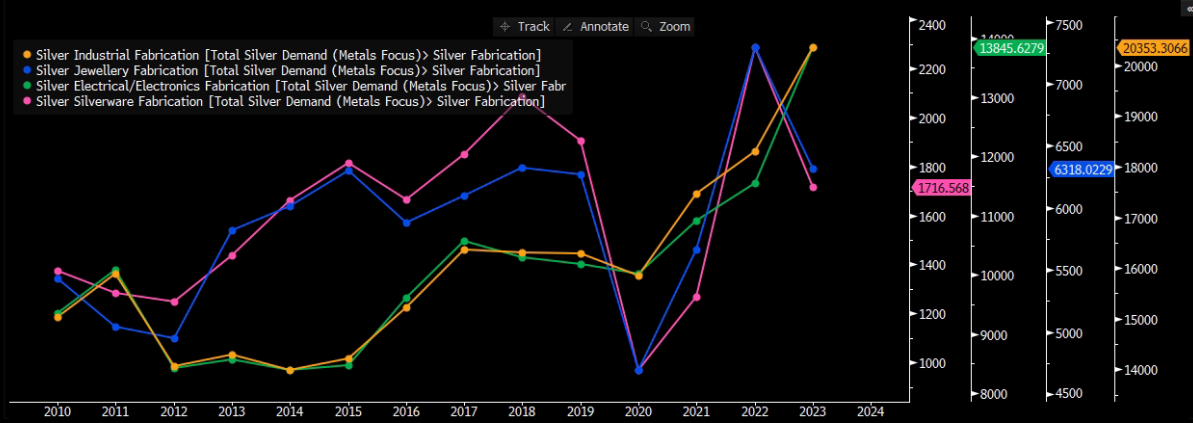
Total silver demand declined by around -6.4% YoY in 2023; led by declines in Jewellery and Silverware fabrication. We attribute the declines to weak Jewellery and Silverware consumption due to cost-of-living and inflationary pressures.

In contrast, Industrial demand grew by 11% YoY, while the electrical and electronics sector grew by around 20% YoY. This reflects silver’s growing demand from the solar panel sector, which surged by 64%. Silver is a key component in making photovoltaic cells (PV)- which help convert sunlight into electricity.

Demand for Silver from Solar PV of solar PV is forecasted to accelerate in most International Energy Agency’s (IEA) scenarios, as seen below.
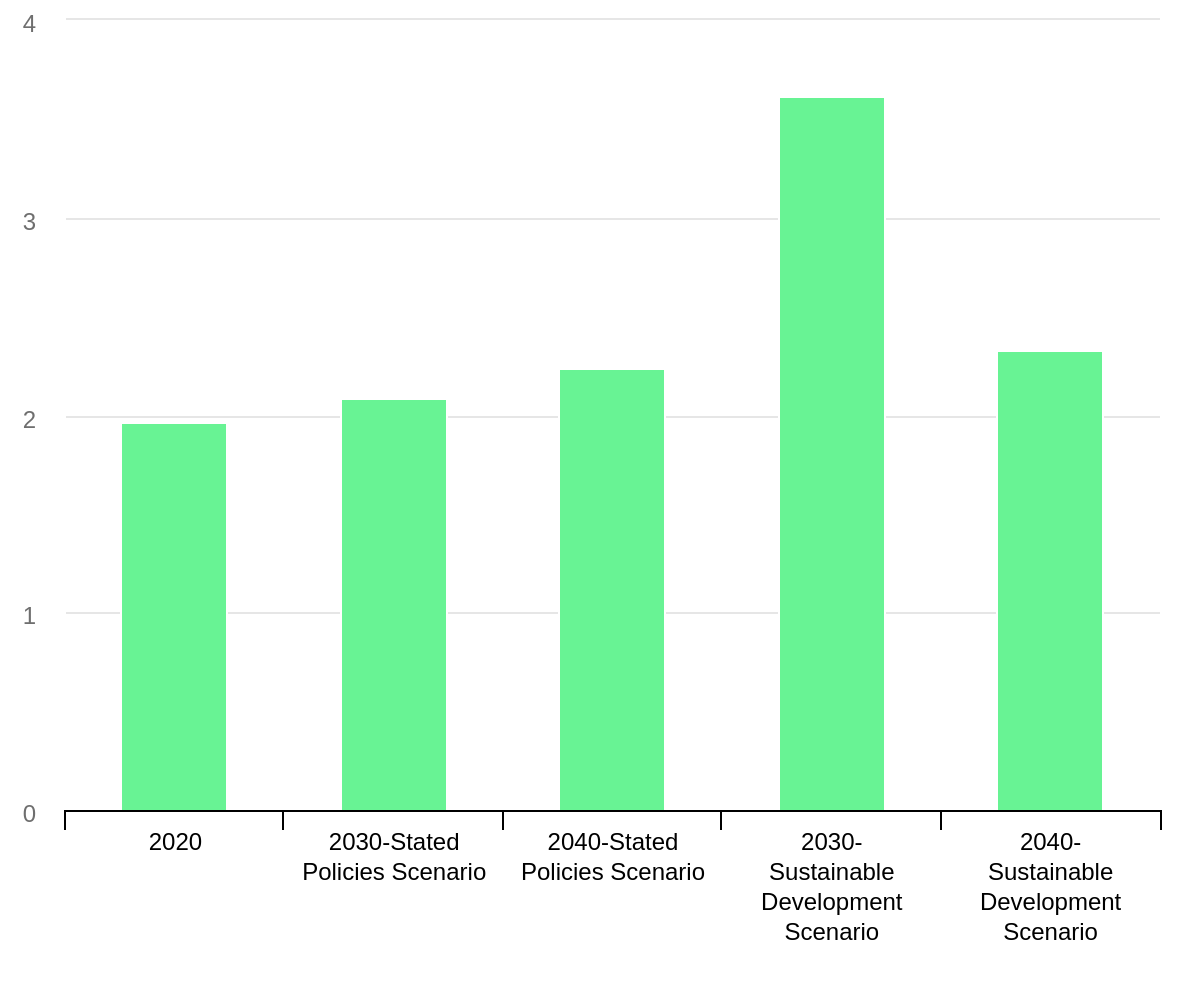
 

Source: IEA, Mineral demand from solar PV by scenario, 2020-2040


Potential Tailwinds from Rate Cuts

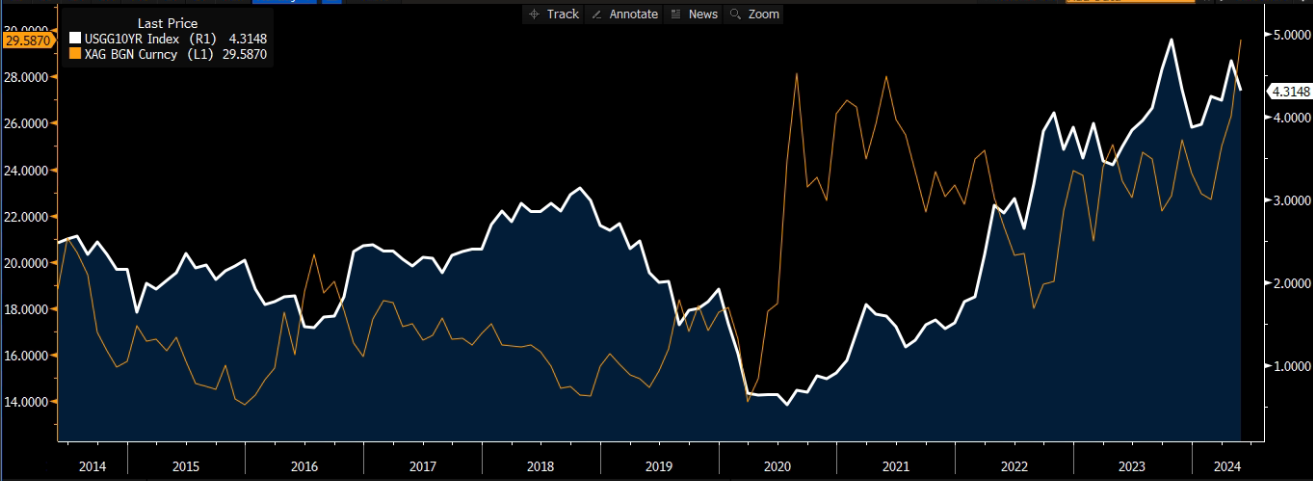
Historically, the prices of precious metals like gold and silver tend to rise during periods of low/declining interest rates. This is because lower rates make non-interest bearing precious metals more attractive compared to interest-yielding assets like bonds.


Thus, potential rate cuts by the Fed this year may serve as a bullish tailwind for Silver.


Silver’s Relationship with Gold: Silver as a Higher-Beta precious metal

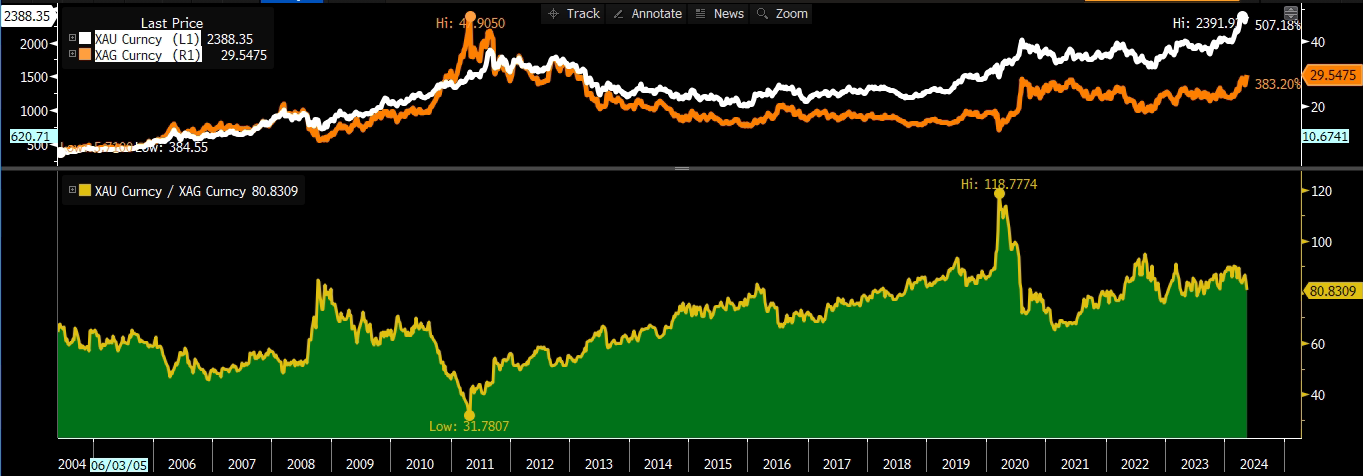
Gold prices recently hit record highs above $2,350/ounce, while, Silver is currently trading around $29.50/ounce, far from its 2011 peak of $50.

When comparing the 2 metals, Gold is mainly used for jewellery/investment, whereas Silver has more industrial use cases in automotive and electronics. Because it is more closely linked to the industrial economy, Silver typically outperforms Gold when the economy is doing well.

Over the past decade, Silver and Gold has been highly correlated, with a correlation of around 0.80 according to Bloomberg. However, Silver has exhibited a still-low but stronger correlation with equities compared to Gold.

Silver has a correlation of 0.27 and Beta of 0.43 with the S&P 500, while Gold is at 0.11 and 0.091 Beta respectively. This reflects Silver’s industrial demand and its greater sensitivity to the market (Beta).


Gold-Silver Ratio exhibiting a Bullish Signal

The Gold-Silver ratio is a commonly cited metric that represents the amount of Silver required to purchase one ounce of Gold. This ratio can be used to measure which Metal is undervalued or overvalued.


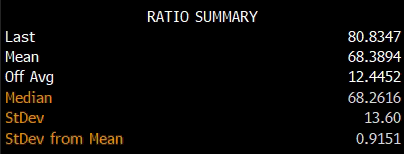
As seen above, the Gold-Silver ratio is currently at 80.8347, which is well above the 20-year average ratio of around 68.3894. This implies that Silver could be undervalued compared to Gold. Potential mean reversion could signal an upcoming bull run for Silver.


Technical Analysis

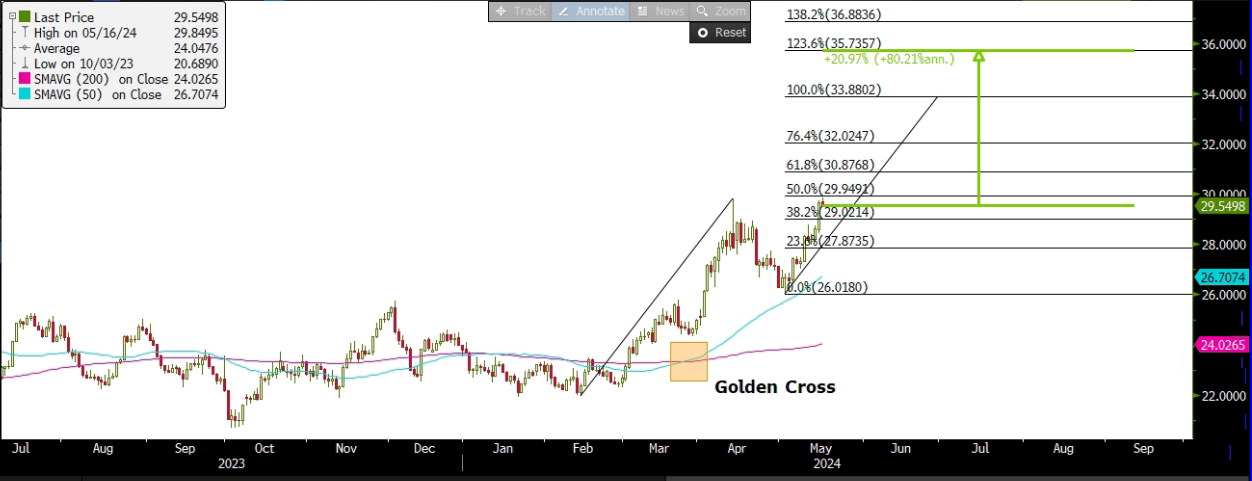
If the Gold-Silver ratio undergoes mean reversion and assuming gold prices stay within or above a range of $2,300-$2,400, this implies that Silver prices could trade around $33 to $35 per ounce based on the historical mean Gold-Silver Ratio of 68.


In the near-term (3-6 months), based on Fibonacci Extension levels drawn from the February 2024 low, we expect Silver prices to test key resistance at the 123.6% extension level around 35.7357 per ounce. This reflects an upside of around 21%. A Golden Cross supports our bullish thesis.

Promotion on COMEX Silver Futures

Trade COMEX Silver Futures at only 50 cents* – Learn more now!


Trade Stocks, ETFs, Forex & Futures on Phillip Nova

Features of trading on Phillip Nova

  • Gain Access to Over 20 Global Exchanges
    Capture opportunities from over 200 global futures from over 20 global exchanges
  • Trade Opportunities in Global Stocks
    Over 11,000 Stocks and ETFs across Singapore, China, Hong Kong, Malaysia and US markets.
  • Over 90 Technical Indicators
    View live charts and trade with ease with over 90 technical indicators available in the Phillip Nova platform
  • Trade Multiple Assets on Phillip Nova
    You can trade Stocks, ETFs, Forex and Futures on a single ledger with Phillip Nova


An Exchange Traded Fund (ETF) is a marketable security that is formed to track nearly anything, ranging from a specific index, sector, commodity, or increasingly, theme. They are most commonly used to track a basket of stocks, and can typically be accessed through the same channels as regular stocks. ETFs are typically separated into passively-managed ETFs that simply mirror the security they are tracking (e.g. the STI), and actively managed ones that attempt to deliver higher returns or specific investment objectives, often with a pre-specified theme in mind (e.g. ARK Invest’s Innovation ETF).

Why should I trade in ETF CFDs?

  • ETFs have been growing in popularity over the years. 2020 was the best year for ETFs yet, with global equity ETFs seeing more than $1T in inflows within a 12-month period. Using CFDs to gain exposure to ETFs allows for greater capital efficiency because only a portion of the contract value is required as margin to establish a position.
  • ETFs are particularly popular with investors seeking a relatively hassle-free investing experience, while desiring exposure to a range of specific and relatively understandable securities. Trading ETF CFDs brings greater convenience by eliminating the need for traders to hold multiple currencies in order to access global ETFs.
  • An investor wanting exposure to the post-pandemic economic recovery could open a position in the well-known SPDR S&P 500 ETF (SPY), which tracks the performance of the S&P 500. Another investor that may be convinced of the future importance of Environmental, Social and Governance concerns (ESG) may find the increasing selection of ESG-themed ETFs that track a basket of high ESG-rating companies to be a good investment, rather than cherry-picking individual equities by hand. ETF CFDs can act as a powerful tool for traders can profit from both directions of the market by taking on long or short positions.

A look at two ETF CFDs we offer:

1) Has the ARKK been sunk?

ARK Innovation ETF (ARKK) ARKK is an actively managed ETF by ARK Invest that invests in a range of companies based on their innovative and industry-disrupting potential. ARKK’s largest holdings are in companies such as Tesla, Square, and Zoom. ARKK is down around -33% from peaking on 12th Feb and is currently in the red for the year to date as the market experiences a risk-off outflow of funds. Superstar fund manager Cathie Wood has however been consistently doubling down on her bets, buying even more shares in growth stocks that are going through their own tumultuous periods such as DraftKings, Peloton, Teladoc, and Tesla. In her view, ARKK is playing the long game, and remains steadfastly convinced in the long-term prospects of these growth stocks beyond this current bout of volatility. Similarly on outflows, investors are still betting big on ARKK as ARK Invest has only lost about $1.2B in assets this year across all its six funds, compared to seeing an inflow of $15.1B during the same period. Recently, investors have been nervously eyeing ARKK’s basket of tech stocks as their future earnings potential remain vulnerable to erosion through high inflation – the dominant concern of the market in recent weeks. As commodities – the major contributor to the recent heightened inflation fears – drops sharply from record highs, are investor concerns over hyperinflation overblown?

2) Searching for exposure to Asian equities?

iShares MSCI Asia ex Japan ETF (AAXJ) The AAXJ is currently trading -10.6% adrift of all-time highs seen in February, giving up gains in tandem with an Asia-wide equity sell-off at the time. Given that slightly over 40% of the ETF’s holdings are based in China, the ongoing tumult seen in Chinese equities currently have carried over nearly perfectly in the AAXJ, as Chinese investors take a breather after the stellar gains made over the past year. Looking ahead, Asia – and particularly China, is steaming ahead with its economic recovery. China is widely expected to be one of the best-performing major economies this year, providing a major boost to the outlook for corporate earnings. As the rest of Asia and the world gradually opens up their own economies, AAXJ is likely to again benefit from strong Asian outperformance amidst a strengthening trade outlook.

CFD is available for trading on Phillip MetaTrader 5 (MT5).

Features of trading CFD:

  • Trade in both the bull and the bear markets
    The ability to enter a long and/or short position allow traders to take advantage of both rising and falling markets.
  • Smaller barrier to entry
    Flexible and smaller contract sizes. This means that traders will be able to enter into a contract with a modest amount of capital.
  • No expiration date or risk of delivery
    Unlike futures which commonly have a fixed expiration date, CFD allows traders to perpetually hold the position(s). CFD is cash settled, no need to worry about the delivery of the underlying asset.


Benefits of using Phillip MT5:

Trade at zero commission on a dynamic platform that offers low spreads. Integrated with Autochartist and Trading Central Indicators, and available on mobile, web and desktop app, you will never miss a trading opportunity with Phillip MT5.

Register for a FREE 30-day Phillip MetaTrader 5 Demo Account

More Market Trends

By Priyanka Sachdeva, Senior Market Analyst for Phillip Nova   Gold Market Snapshot Gold prices corrected sharply after a quiet weekend in the Russia-Ukraine conflict.

Read More >

Weekly report courtesy of Eurex A jubilant mood on Wall Street, sideways movement on Europe’s stock markets – after the turbulent previous week, events still

Read More >