By Eric Lee, Sales Director, Phillip Nova

Gold has been considered a safe-haven asset that helps to preserve wealth during times of economic uncertainty and geopolitical turbulence. Looking at the current market conditions and technical indicators, it suggests that a potential uptrend is on the horizon. Let us dive into the bullish case for gold trading in this article.
1) Weekly Chart Analysis: Signs of Shift in Sentiment
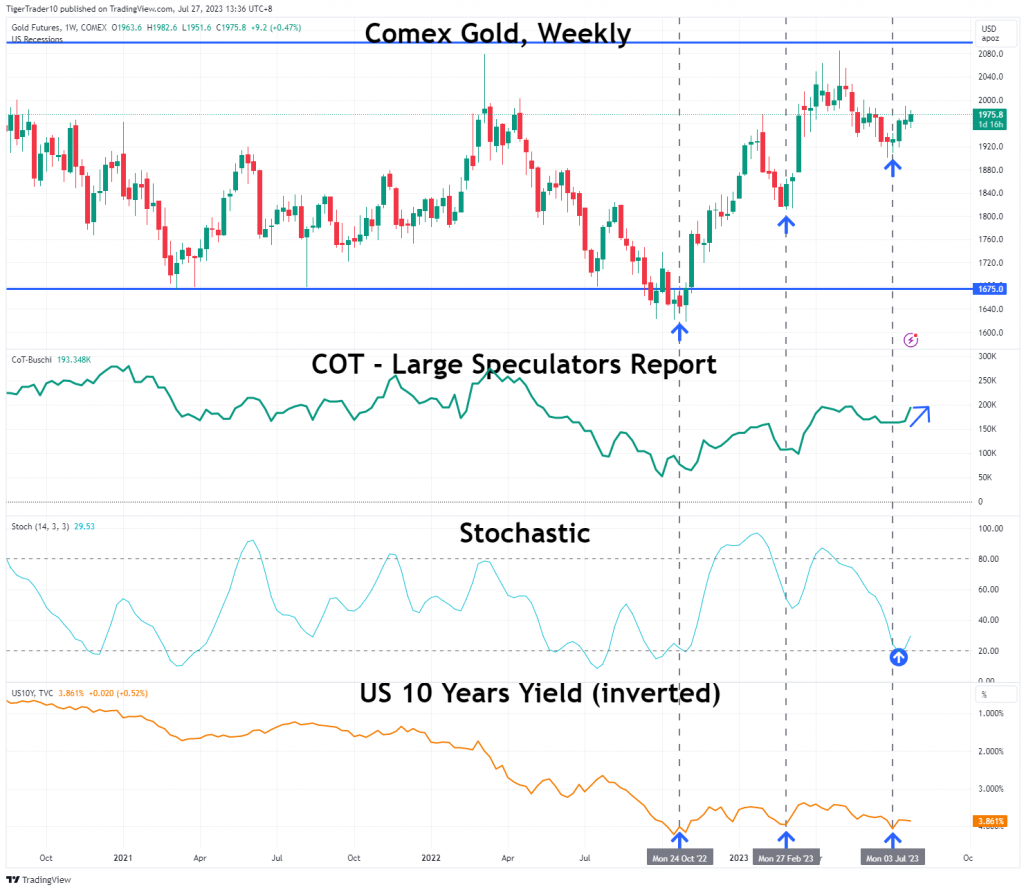
The weekly chart for gold reveals several encouraging indicators that point towards a potential uptrend:
a) Commitment of Traders Report:
After enduring a challenging period of three months during which Large Speculators were net sellers of gold futures contracts, the tide seems to be turning. The latest Commitment of Traders report indicates that large speculators are becoming net buyers of gold. This shift in sentiment suggests renewed confidence in the precious metal and may lay the groundwork for further price appreciation.
b) Weekly Stochastic Indicator:
The Stochastic indicator, a momentum oscillator, has been operating in the oversold region, indicating potential undervaluation. However, the recent upturn in the Stochastic from the oversold region could signal a change in price direction. As buying momentum gains traction, gold prices may experience an upward push.
c) Inverse Relationship with US 10-Year Yield:
Gold’s inverse relationship with US 10-Year Treasury yields has been evident since late 2022. With inflation exhibiting signs of stabilisation, falling yields are being perceived positively for gold. As the US 10-year yield shows signs of peaking since early July, this could provide additional support for the yellow metal’s price rise.
2) Daily Chart Analysis: Building Momentum for Breakout
The daily chart presents further insights into the bullish case for gold:
a) KST Crossing Upward:
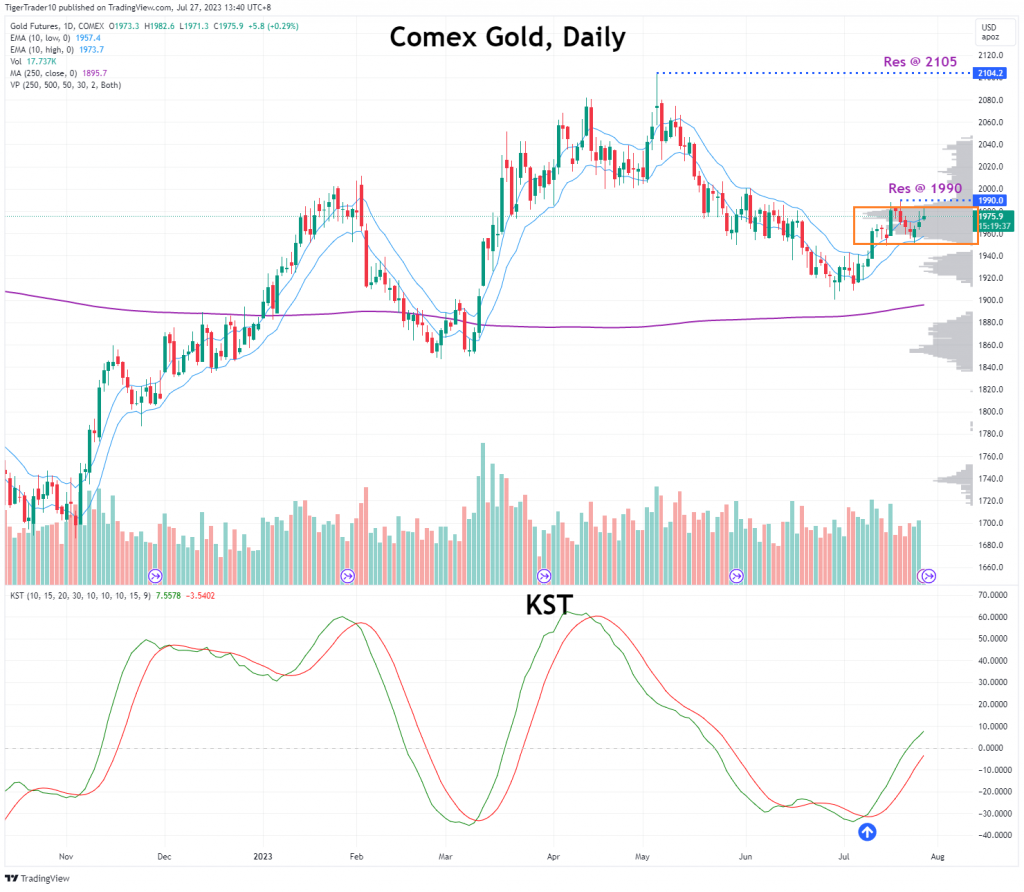
The daily KST (Know Sure Thing) indicator provides valuable information about the trend’s momentum. Since crossing upward on July 11th, the KST has continued its upward trajectory. This bullish momentum suggests that gold’s price may have room to grow in the short term.
b) Volume Analysis:
Volume analysis is a crucial aspect of technical analysis, and it indicates the strength of market moves. Observing the gold market’s volume between the price range of 1960 to 1990, there are signs of accumulation. This suggests that market participants are accumulating gold at these price levels, which may indicate their confidence in a potential price increase.
c) Breaking Resistance Levels:
The daily price action reveals that gold is currently facing a resistance level around 1990. Once the precious metal breaks above this level, it could gain significant momentum and set its sights on the next resistance level of 2105. A decisive breakout beyond resistance would signal a powerful bullish move.
d) Strong Support at 1900:
As gold continues its upward journey, it enjoys strong support at the 1900 price level. This support level provides a safety net for investors and helps protect against excessive downside risk.
As the global economic landscape evolves, the yellow metal’s historical role as a safe-haven asset may once again shine brightly for savvy investors. The stage is set for gold to shine bright again.
Traders interested in trading gold can consider trading Comex Gold futures on the Phillip Nova platform or XAUUSD (spot gold) on the Phillip MT5 platform.
In addition, Phillip Nova offers COMEX – Micro Gold (MGC), where the margin is at a fraction of the standard size. What is more, for a limited period only, customers can get to trade this contract at a promotional rate of USD $0.98 [excluding exchange fees].
Trade US Indices, Gold, and Crude Oil at only $0.98*
Value-Added Service from Eric Lee
My clients benefited from my services including investment advisories in unit trust and stocks, investment insights based on my personal knowledge and experiences while navigating the markets for the past 20 years.
Periodically, I will be send out market analysis to my clients, as well as alerting them of support and resistance levels for the technical indicators which I am utilising on a chart. Click on the button at the bottom if you would like to arrange for a One-to-One Coaching session to learn more about trading futures, forex, stocks and more, and how you can benefit from the services I provide.

Eric Lee is a Sales Director with Phillip Nova. With expertise in Futures, Forex, Stocks, and Unit Trust, Eric makes an all-rounded advisor. Make informed trading decisions without spending time combing through endless information as Eric readily provides clients with trade alerts and insights via WhatsApp. Over his years of experience, Eric developed systematic strategies in trading and investing. Book a complimentary coaching session below to leverage on his expertise as he imparts his knowledge to enhance your trading journey.
- Open an account now
- Free Phillip Nova Demo Account
- Free Phillip MT5 Demo Account
*T&Cs apply, contact Eric below for more information.


