By Priyanka Sachdeva, Senior Market Analyst for Phillip Nova & Lim Jun Kit, Senior Strategist for Phillip Nova
The Fundamentals
Gold experienced a significant increase in value throughout 2024 due to factors such as central banks’ preference for gold reserves, geopolitical tensions favoring the appeal of gold as a safe asset, and expectations of interest rate cuts. With a year-to-date increase of 30%, gold reached an all-time high of $2,710 per ounce.
While many fundamental factors continue to support a positive long-term outlook for gold, the stronger-than-expected US Dollar index is currently the only obstacle. We are approaching a significant market-moving event that could introduce a major political shift in the world’s largest economy, leading to limited speculative trading in gold for the time being. Volatility is expected to persist in gold trading until the conclusion of the elections in the world’s biggest economy.
The current upward trend in gold is driven by market sentiment favouring gold as a safe asset and apprehension about investing in riskier assets. Gold appears to be overbought across multiple time frames, having surpassed various technical levels on the upside. There is a noticeable lack of consolidation between the $2500 and $2700 levels, indicating the possibility of a pullback. However, the timing of such a sentiment shift is still uncertain.
Technical Analysis
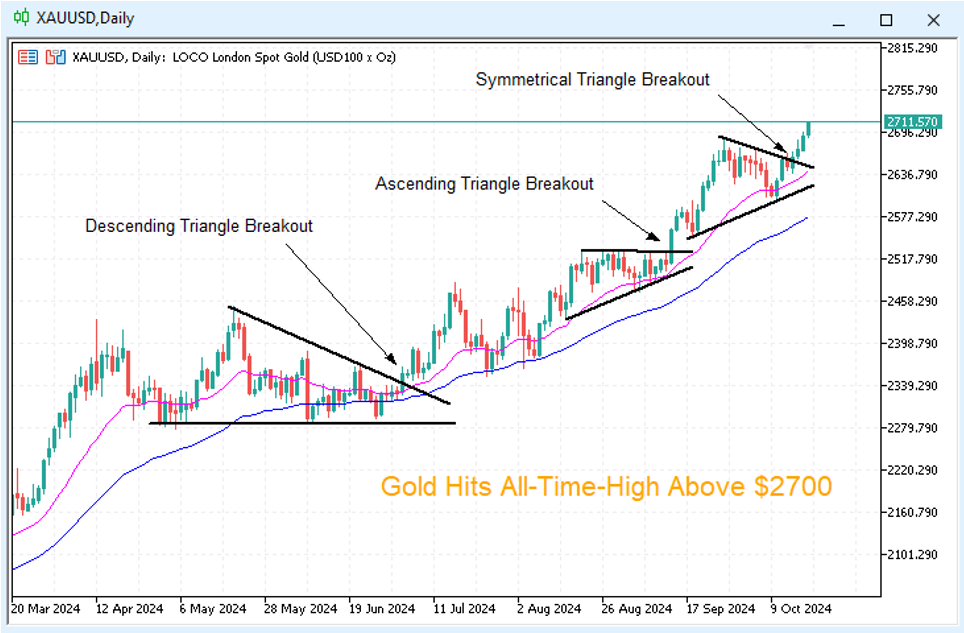
Gold has been on a stellar run in 2024, surging more than 31% year-to-date, and recently hitting an all-time high above $2710 per ounce. This remarkable rally has been fuelled by a combination of macroeconomic factors and strong technical signals, making gold a standout performer in the financial markets. The past few months have seen a series of bullish breakouts, continuing an uptrend that began earlier in the year.
A Series of Bullish Breakouts
Gold’s rally is not new—its upward momentum has been unfolding throughout 2024. The recent breakouts captured in the chart are just a continuation of this long-term trend. In July 2024, gold saw a descending triangle breakout, signaling the continuation of its bullish movement. The rally gained further strength with an ascending triangle breakout in September, as buyers consistently pushed the price higher. Finally, in October, a symmetrical triangle breakout propelled gold past the key psychological level of $2700/oz, marking a new all-time high.
These technical breakouts are a reflection of gold’s continued strength, as the market consolidates and breaks higher, offering traders opportunities to participate in this powerful trend.
Trader’s Tips: Timing Entries Using Triangle Patterns
In a strong bullish market, triangle patterns can be incredibly useful for traders to identify potential entry points and capitalize on breakouts.
- Descending Triangle: This pattern is typically a continuation signal. When it forms in a bullish trend, like in gold’s case in July, a breakout above resistance usually signals further upward movement.
- Ascending Triangle: Seen in gold’s price action in September, this bullish pattern is marked by rising lows that test a horizontal resistance. A breakout through resistance often triggers another leg higher.
- Symmetrical Triangle: A neutral pattern that can break either way, but in gold’s strong trend, the breakout in October followed the prevailing momentum, driving prices to new highs.
When trading these patterns, it’s essential to confirm breakouts before taking action. As the saying goes, “Let the market commit to you, before you commit to the market”. Most importantly, always use risk management techniques, such as stop-loss orders, to protect your capital from potential reversals. With gold continuing to climb, traders can look to capitalise on further bullish movements by recognizing and trading these classic triangle patterns.
Trade Spot Gold, Gold ETF, Futures & Options with Phillip Nova
Trade Spot Gold, Gold ETF, Futures & Options on Phillip Nova 2.0 now! Try a demo here. Click here to open an account now.
Trade Stocks, ETFs, Forex & Futures on Phillip Nova
Features of trading on Phillip Nova
- Gain Access to Over 20 Global Exchanges
Capture opportunities from over 200 global futures from over 20 global exchanges
- Trade Opportunities in Global Stocks
Over 11,000 Stocks and ETFs across Singapore, China, Hong Kong, Malaysia and US markets.
- Over 90 Technical Indicators
View live charts and trade with ease with over 90 technical indicators available in the Phillip Nova platform
- Trade Multiple Assets on Phillip Nova
You can trade Stocks, ETFs, Forex and Futures on a single ledger with Phillip Nova


