By Danish Lim, Investment Analyst, Phillip Nova
Silver has outperformed Gold so far, up by around 25% YTD, compared to Gold at 16%. Silver recently posted its highest close in 11 years, as April CPI data helped boost rate-cut bets, which historically benefits non-interest bearing precious metals.
Silver is mainly produced in the Americas, particularly Mexico, Peru, and Chile. China, Australia, and Russia are also major producers.
Silver Macro Overview: Solar Demand to Widen Supply Deficit
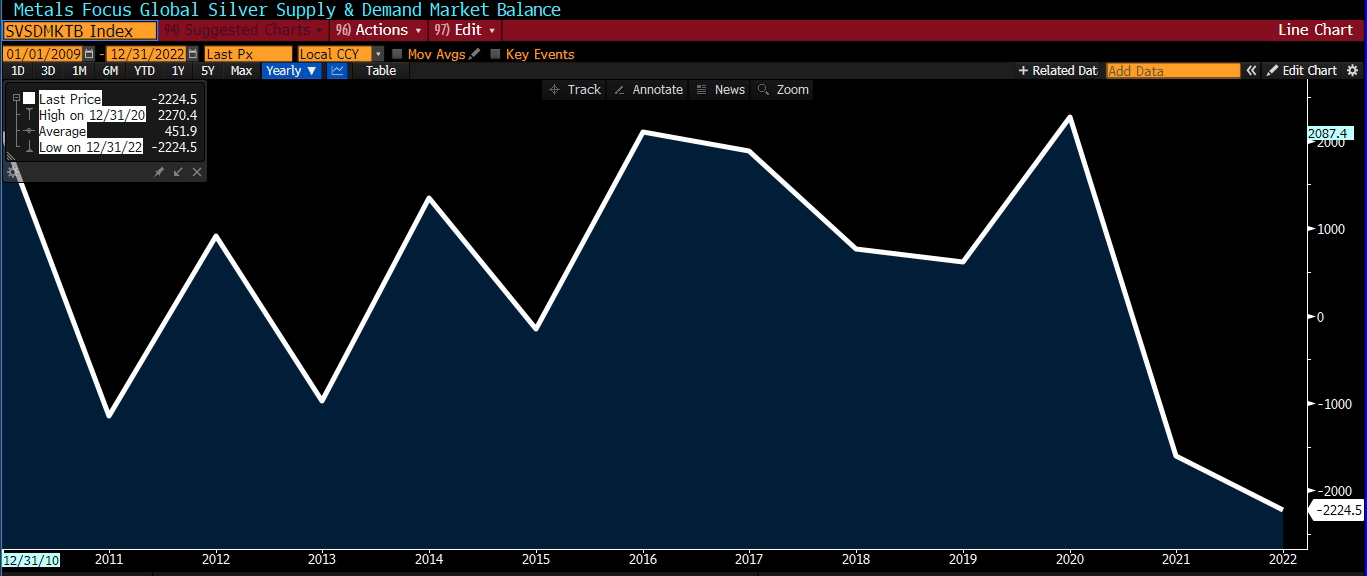
As of the end of 2022, silver is facing its largest supply deficit of around -2,224.5 metric tonnes in over a decade, revealing an imbalance in the silver market.
Silver Demand Drivers
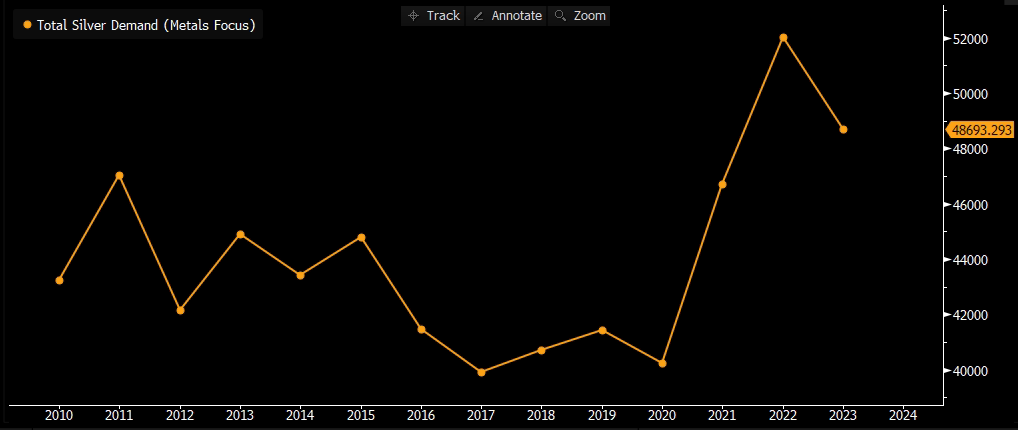
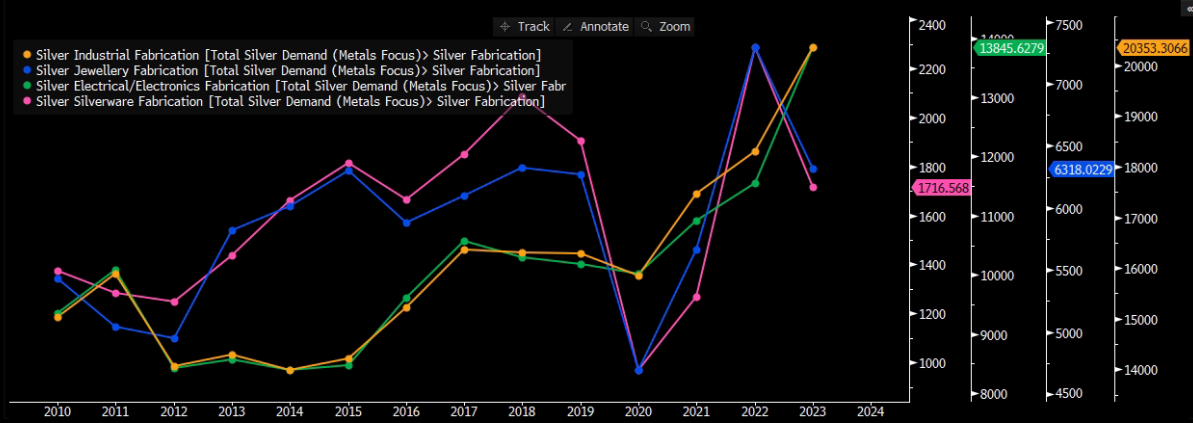
Total silver demand declined by around -6.4% YoY in 2023; led by declines in Jewellery and Silverware fabrication. We attribute the declines to weak Jewellery and Silverware consumption due to cost-of-living and inflationary pressures.
In contrast, Industrial demand grew by 11% YoY, while the electrical and electronics sector grew by around 20% YoY. This reflects silver’s growing demand from the solar panel sector, which surged by 64%. Silver is a key component in making photovoltaic cells (PV)- which help convert sunlight into electricity.
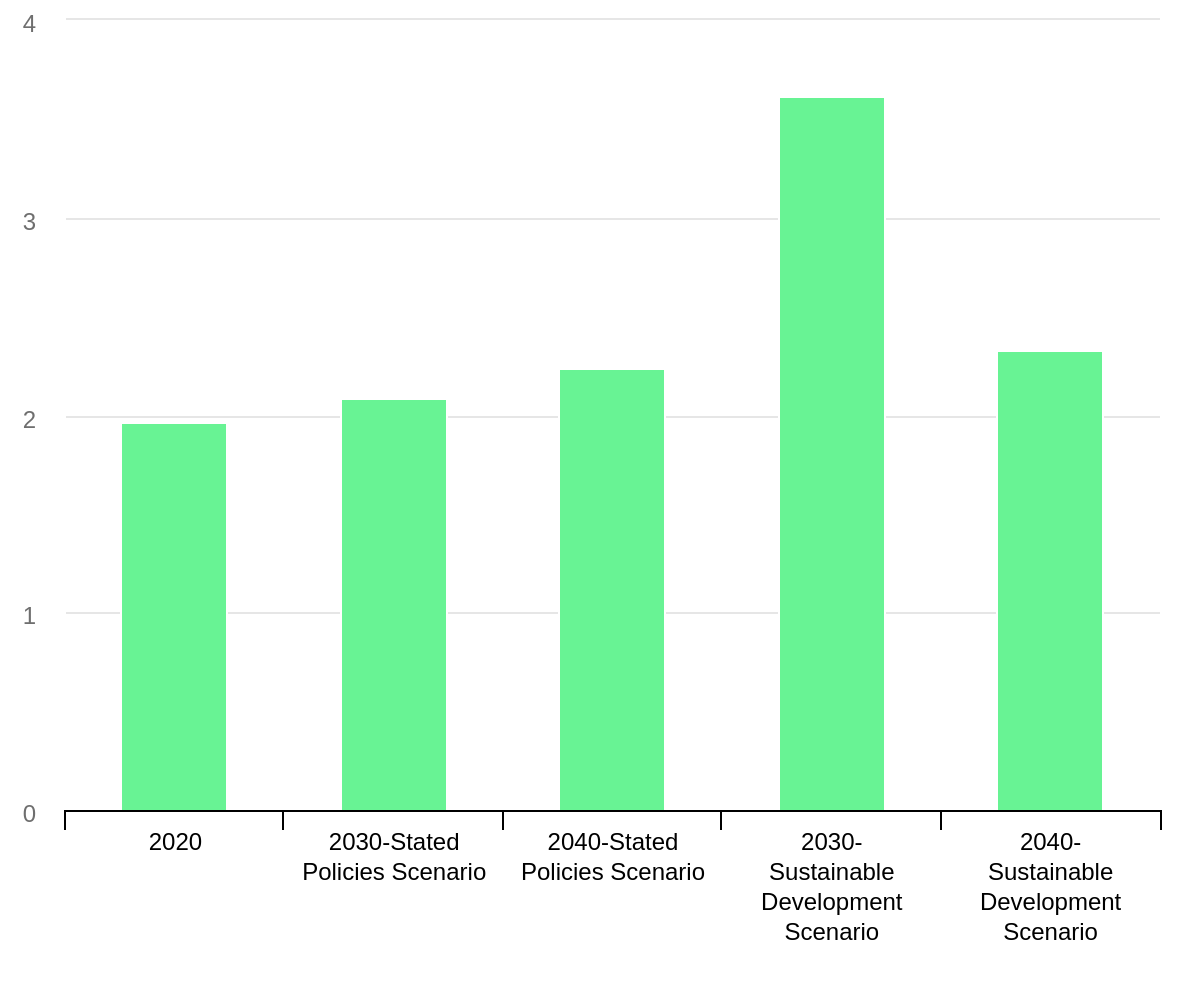
Demand for Silver from Solar PV of solar PV is forecasted to accelerate in most International Energy Agency’s (IEA) scenarios, as seen below.
Potential Tailwinds from Rate Cuts
Historically, the prices of precious metals like gold and silver tend to rise during periods of low/declining interest rates. This is because lower rates make non-interest bearing precious metals more attractive compared to interest-yielding assets like bonds.
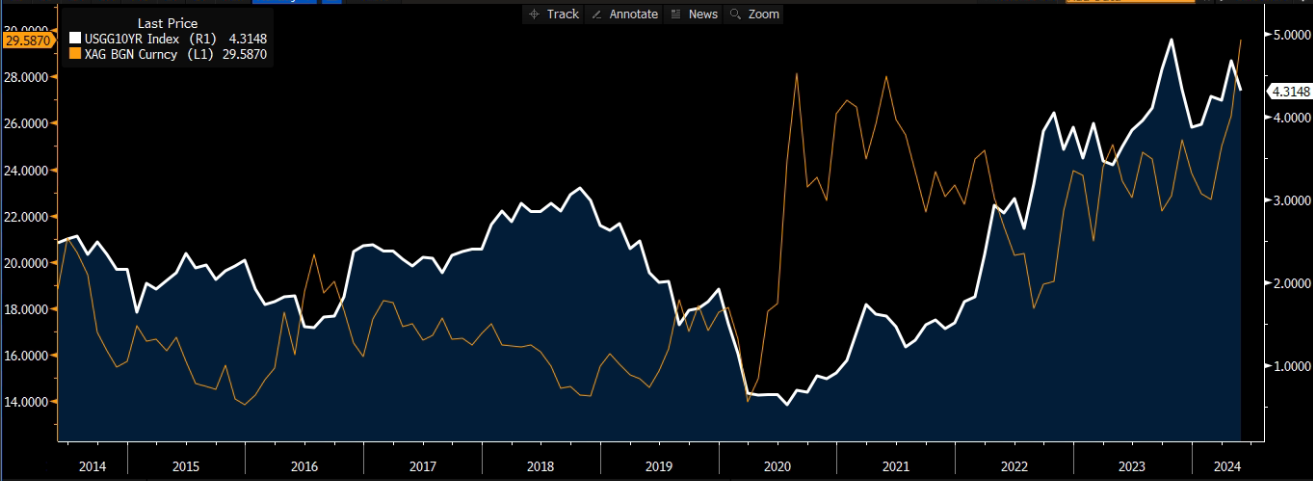
Thus, potential rate cuts by the Fed this year may serve as a bullish tailwind for Silver.
Silver’s Relationship with Gold: Silver as a Higher-Beta precious metal
Gold prices recently hit record highs above $2,350/ounce, while, Silver is currently trading around $29.50/ounce, far from its 2011 peak of $50.
When comparing the 2 metals, Gold is mainly used for jewellery/investment, whereas Silver has more industrial use cases in automotive and electronics. Because it is more closely linked to the industrial economy, Silver typically outperforms Gold when the economy is doing well.
Over the past decade, Silver and Gold has been highly correlated, with a correlation of around 0.80 according to Bloomberg. However, Silver has exhibited a still-low but stronger correlation with equities compared to Gold.
Silver has a correlation of 0.27 and Beta of 0.43 with the S&P 500, while Gold is at 0.11 and 0.091 Beta respectively. This reflects Silver’s industrial demand and its greater sensitivity to the market (Beta).
Gold-Silver Ratio exhibiting a Bullish Signal
The Gold-Silver ratio is a commonly cited metric that represents the amount of Silver required to purchase one ounce of Gold. This ratio can be used to measure which Metal is undervalued or overvalued.
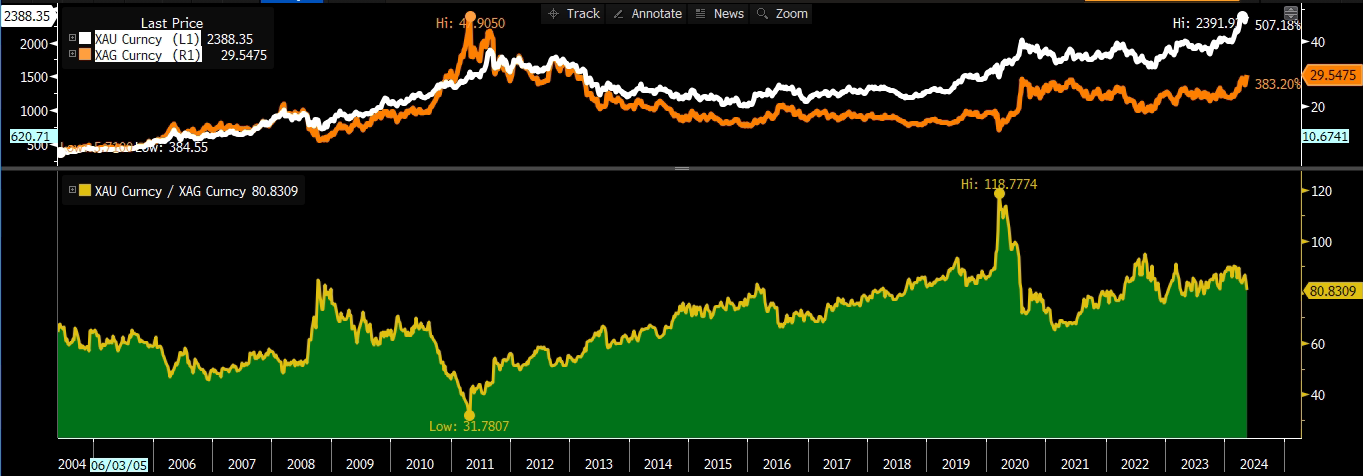
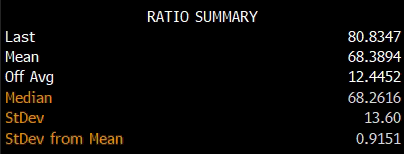
As seen above, the Gold-Silver ratio is currently at 80.8347, which is well above the 20-year average ratio of around 68.3894. This implies that Silver could be undervalued compared to Gold. Potential mean reversion could signal an upcoming bull run for Silver.
Technical Analysis
If the Gold-Silver ratio undergoes mean reversion and assuming gold prices stay within or above a range of $2,300-$2,400, this implies that Silver prices could trade around $33 to $35 per ounce based on the historical mean Gold-Silver Ratio of 68.
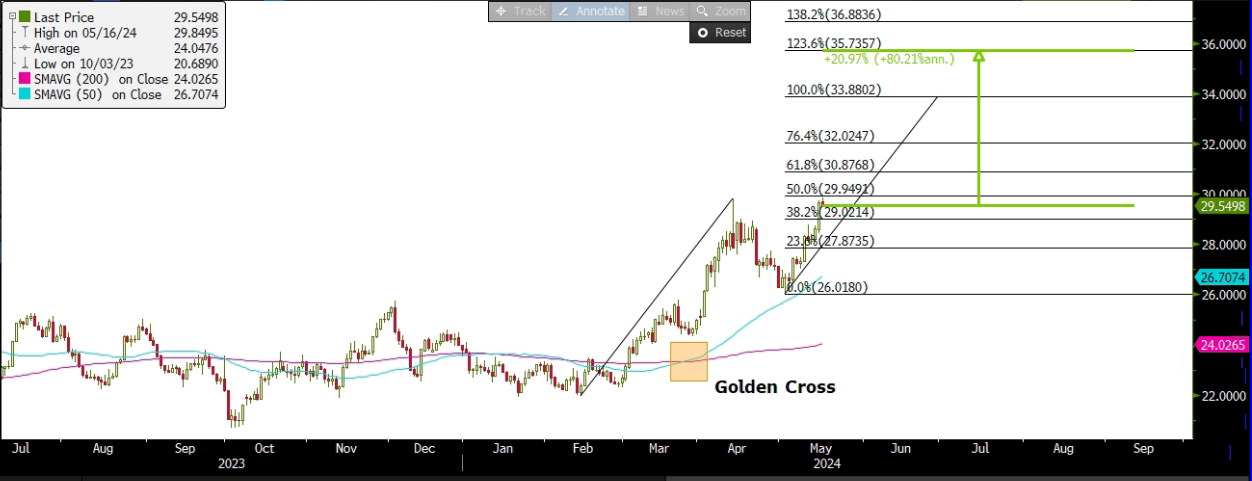
In the near-term (3-6 months), based on Fibonacci Extension levels drawn from the February 2024 low, we expect Silver prices to test key resistance at the 123.6% extension level around 35.7357 per ounce. This reflects an upside of around 21%. A Golden Cross supports our bullish thesis.
Promotion on COMEX Silver Futures
Trade COMEX Silver Futures at only 50 cents* – Learn more now!
Trade Stocks, ETFs, Forex & Futures on Phillip Nova
Features of trading on Phillip Nova
- Gain Access to Over 20 Global Exchanges
Capture opportunities from over 200 global futures from over 20 global exchanges
- Trade Opportunities in Global Stocks
Over 11,000 Stocks and ETFs across Singapore, China, Hong Kong, Malaysia and US markets.
- Over 90 Technical Indicators
View live charts and trade with ease with over 90 technical indicators available in the Phillip Nova platform
- Trade Multiple Assets on Phillip Nova
You can trade Stocks, ETFs, Forex and Futures on a single ledger with Phillip Nova


