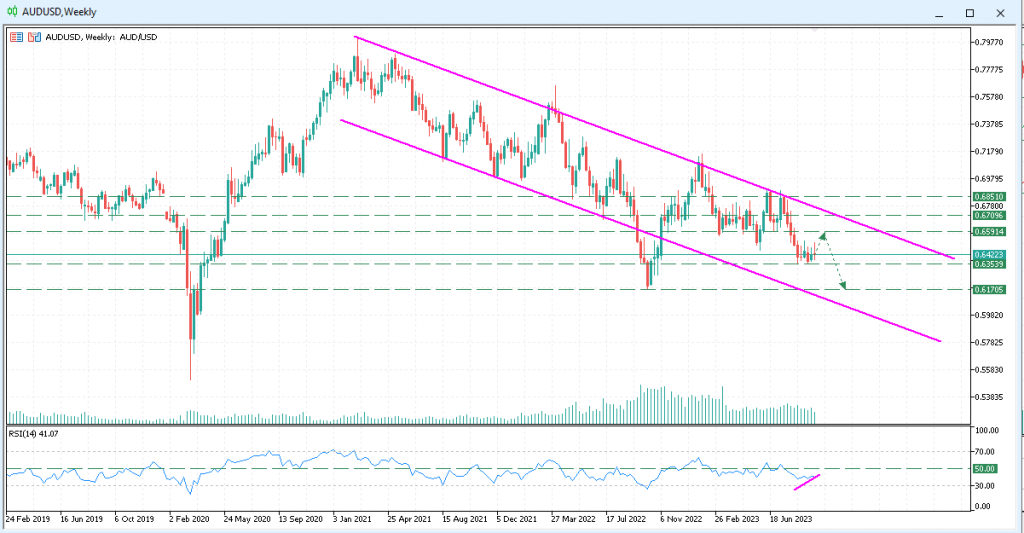
The Australian Dollar peaked to 0.80 in February 2022, but it has since depreciated significantly, now hovering around 0.64 against the US Dollar.
Moreover, year-to-date, the AUDUSD currency pair has declined over 5% and is predicted to remain in this slump, due to a lack of evidence for a lasting bullish reversal in the foreseeable future. However, we anticipate a short rebound momentarily in the midst of the slump.
In this article, we have outlined a few observations that support our projection of the AUDUSD prices.To start off, upon examination of the weekly chart, the decline of AUDUSD becomes evident. Since February 2022, the AUDUSD pair has consistently reflected lower highs and lower lows and by connecting these higher highs and lower lows respectively with two trend lines, parallel resistance and support trendlines are established, and it displays a descending channel.
In technical analysis, a descending channel typically signposts a bearish market bias, and presents traders with opportunities to sell near the upper trendline and buy near the lower trendline.Looking back, the AUDUSD pair has been trapped within this formation, except the period between September and November 2022, where prices broke down briefly drifted from the formation.As such, we foresee further weakening for the AUDUSD pair, testing the lower support band of the channel by year-end.
However, we anticipate a temporary uptick movement in the near term, due to a bullish divergence in the Relative Strength Index (RSI). The RSI is a momentum indicator that suggests overbought conditions when its graph is above 70, and oversold when it is below 30. For readings below the neutral line of 50, it means the prevailing momentum is bearish. At the time of writing, the RSI is in the bearish territory around 41, which echoes our overall bearish sentiment mentioned earlier. However, a bullish divergence was spotted at the start of August, amidst its bearish momentum. A bullish divergence is identified when the chart prices create lower highs while the RSI reading creates higher highs. This is an indication that the bearish momentum is waning and prices are bound for reversal to the upside.
Looking ahead, we project a short-term rebound to our target at R1 (0.659) as it is a previous support-turned-resistance level. If the price pierces above R1, it would be headed to test the formidable resistance zone R2 (0.67) which coincides with the upper band of the descending channel. The aforementioned resistance levels could be potential entries for short positions, as we view that the probability of a continued downtrend to targets at S1 (0.635) and S2 (0.617) remain high.
Trade Forex on Phillip MetaTrader 5 (MT5).
Trade Forex at zero commission on Phillip MetaTrader 5, a dynamic platform that offers low spreads. Integrated with Acuity’s Signal Centre and Trading Central Indicators, and available on mobile and desktop app, you will never miss a trading opportunity with Phillip MT5.
Download Trading Central’s Market Buzz for updates on more topics.
What’s more? Phillip MT5 is now supported on Mac OS! To install, simply download the file below and complete a simple installation process.


